Proof of Play
Proof of Play reports what played across content, devices, media files, channels, and advertisers. To set up tracking for an element, see Enable Proof of Play.
Use a report to answer questions such as whether a content item played on the intended devices during a given week, or how often a media file appeared. Choose the item and time range first, then use grouping to see the playback from the perspective you need.
Open a report
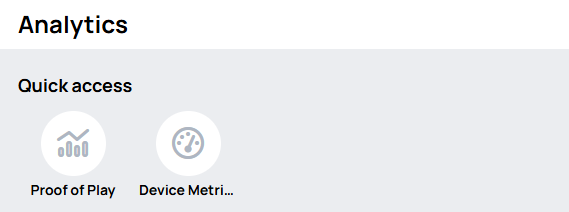
Go to Analytics → Proof of Play to choose a report type.
To start with one item selected, open its details and choose the Proof of Play tab:
Content details

Device details

File details

For a channel, use Go to proof of play from the Channels list.

Choose what to analyze
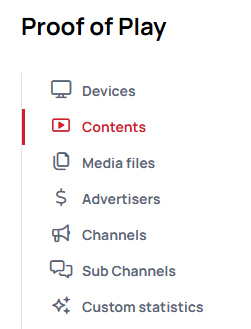
Select Devices, Contents, Media files, Advertisers, Channels, Sub Channels, or Custom statistics. The available filters and groupings depend on the report type.
A disabled report type can mean that no item of that type has been created for your customer.
In an Advertisers report, remember that embedded content and nested Playlists are credited at every level. Learn more: Embedded content and nested playlists below.
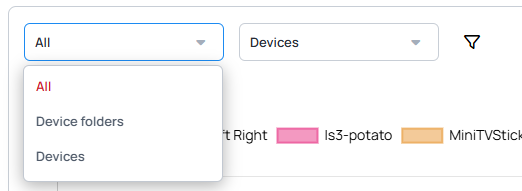
Choose one item or folder to narrow the report. When you arrive from an item's details, that item is already selected.
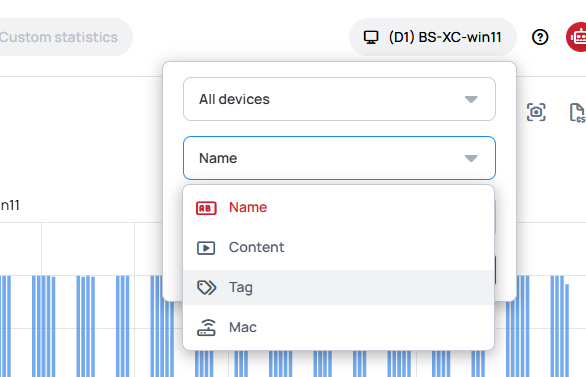
You can also search by tag in content, device, media-file, channel, and sub-channel reports. The report includes entities with the selected tag. Tag search is not available for advertisers or custom statistics.
Set the time range and grouping
Choose a time zone and a preset date range, or set a custom interval. A single query can cover up to three months.

Select one Group by option to break down the report. Available options depend on the report type, selected item, and time range. Use the CSV control on a grouping card when you need its data outside Wallboard.
If a grouping is disabled, try a shorter time range; the option may also be unavailable for the selected report or setup.
Your settings are remembered for your user account, so a report opens the way you last left it. Each report type keeps its own Group by, measured value, time breakdown, and chart type; in Analytics it also keeps the item you selected, and the Analytics reports share one time range and time zone. The Proof of Play tabs on content, device, device-folder, and file details remember their settings separately.

Read and export the chart
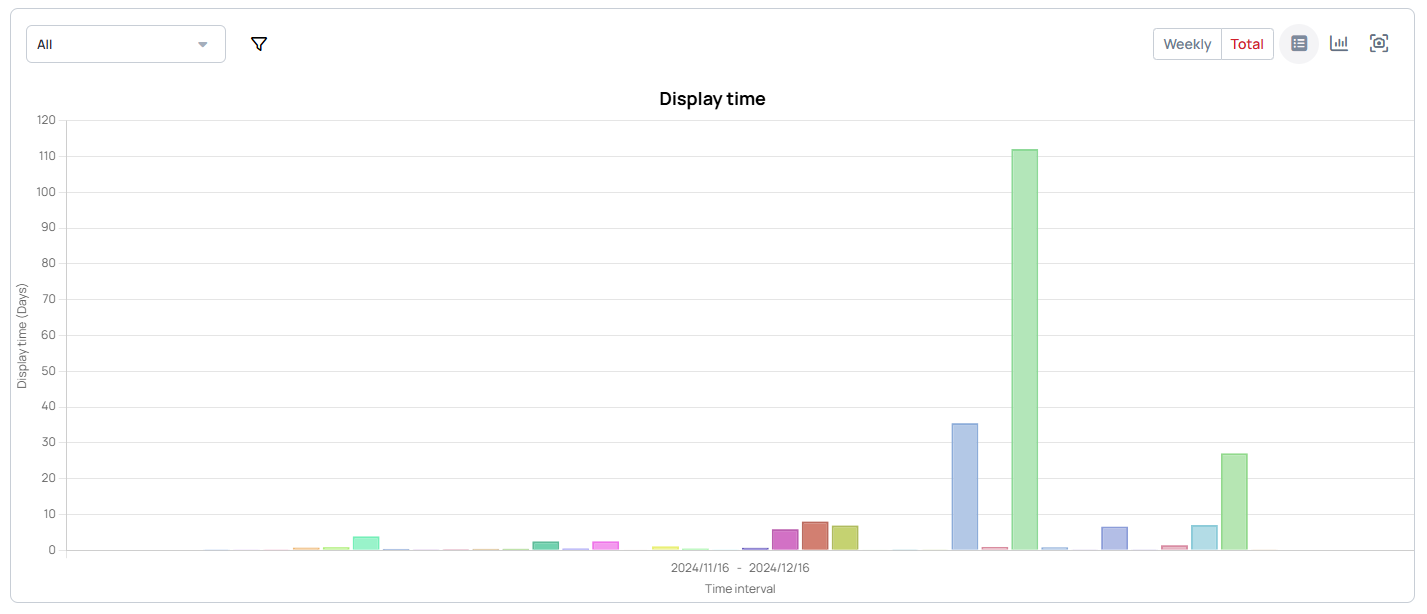
Use the chart controls to change the time breakdown (such as Hourly, Weekly, or Total) or view, and download the chart as a PNG.
A duplicate has a different ID, so its report does not include the original content's Proof of Play history.
Use AI with a report
The AI button in the report toolbar (the magic wand, tooltip AI assistant) opens a menu with two actions that do different jobs:
| Action | What it does |
|---|---|
| Generate filter with AI | Sets up the report. You describe the view you want, review the suggestion, and apply it. |
| Explain with AI | Explains the report you are looking at. It changes nothing. |
Set up a view
- Open the AI menu, choose Generate filter with AI, and describe what you want to see, for example Show plays per day for last month.
- Review the suggestion under This page will be set to. Nothing changes until you apply it.
- Choose Apply to set the report's controls, or Apply & explain to set them and then open a fresh explanation once the new results have loaded.
After applying, the report's normal controls show what was set, and you can change any of them by hand. Learn more: AI Filter Generator § Proof of Play.
The AI can only set what the report itself offers: a text search, the time range and time breakdown, the measured value, the Group by option, and the chart type. Keep these limits in mind:
- A request can be applied in part. Anything the report cannot do is left out, and the rest still applies. The report's usual rules can also adjust a related choice, such as a grouping or chart type that does not fit the new view. Always review the suggestion before applying it.
- There are no number thresholds or combined conditions. A request such as devices that played fewer than 50 times, or this channel on that device, cannot be expressed as a report setting.
- A name becomes a text search. Naming an item searches for that text; it does not select exactly that item.
- Applied settings are remembered like your own. The panel says Nothing is saved, meaning no separate filter is created. The settings you apply become the report's settings, and like settings you choose by hand, the report opens with them next time.
- Reset clears the AI panel only. It removes the prompt and the generated result. It does not change the report or put its settings back to their defaults.
Explain a report
- Open the AI menu and choose Explain with AI. The AI Explanation window opens.
- At the top, it shows what is being explained: the measured value, the time range and, where there is one, the selected item, followed by the report's chart. Table and heat-map views have no chart here; the explanation text is still provided.
- Below that come a short summary and a few sections, some with supporting charts drawn from the report's data.
The explanation is read-only. You cannot ask follow-up questions, and it does not change the report. As the window itself says, it is AI-generated from the data shown, so double-check important figures against the report.
To get a new explanation, choose Re-generate. It explains the report as it was when you opened the window; it does not reload the report's data. If the explanation fails, use the retry button or Re-generate.
While you stay on the page, the last explanation for each type of report (Devices, Contents, and so on) is kept. Opening Explain with AI again shows that earlier answer, even if you have since chosen another item, changed the dates, or the data has changed.
The context and chart at the top of the window always show the report as it is now, so they do not tell you how old the text below them is. When you need an explanation of the current report, set the report up first, open Explain with AI, then choose Re-generate.
Apply & explain does not have this problem: it always asks for a fresh explanation of the new results.
When an action is not available
- Explain with AI is grayed out while the report has no data to explain. Choose a different time range or item first. Generate filter with AI stays available on an empty report, because that is when changing the view is most useful.
- Generate filter with AI is grayed out for a moment while the report is still loading its Group by options.
- The menu reads Explanation is on the way while Apply & explain waits for the new results.
- "The new view has no data to explain" appears when Apply & explain produces an empty report. The settings were still applied; there is just nothing to explain.
- "The explanation could not be opened" appears when the new results did not arrive in time, or the report was changed again before they did. Open Explain with AI from the AI menu once the chart is ready.
Where you can use it
On Analytics → Proof of Play, a request can also move you to another report type you have access to, for example Show me the media files instead.
On the Proof of Play tab of a content, device, or media file, and on the Proof of Play view of a device folder or a selection of devices, the report stays on that subject. The AI can change the time range, breakdown, measured value, and chart, but not what is being reported on.
Who sees the actions
The two actions are shown or hidden separately, in the user interface profile under AI settings:
| Setting | Controls |
|---|---|
| See AI filter generation | Generate filter with AI here, and the AI button in the Devices, Contents, and Files filter sidebar. |
| See Proof of Play AI explanation | Explain with AI. When it is hidden, Apply & explain is not offered either. |
Learn more: User Interface Profiles
What the reports collect
Reporting is switched on in the editor, on the Content or Slide you are building. Two kinds can be collected, and they are independent of each other.
| Setting | What it reports | What it does not report |
|---|---|---|
| Widget statistics | The widget itself: how many times it played, how many clicks it received. | The individual assets playing inside that widget. |
| Asset statistics | Each item played inside the widget, for example every image of a gallery. | The widget as a whole. |
An image widget holds one image, so asset reporting covers that one image. A gallery widget holding five images reports each of the five. If you want both the widget and its contents, switch both on.
Turning widget or asset statistics on or off at the Content level sets what any widget you add from that point on starts with. A widget already on the page keeps its own setting and is not updated — turn it on for that widget individually.
If you want every widget on a page to report, switch these on before you start adding widgets.
Custom asset report lets you define your own asset report, and Page Advertiser attaches an advertiser to a page, which is what makes that page's playback show up in an Advertisers report. Both are set in the editor: see Enable reporting for the Content Designer and Enable reporting for the Slide Designer.
Embedded content and nested playlists
Content is often played inside other content: a Content widget or Contents widget placed on a page, a Channel widget playing the content of a Channel, or a Playlist type page putting one Playlist inside another. When that happens, the report shows every piece that was on screen, not only the innermost one.
An example. Your Playlist has a page that plays another Playlist, and the two have different advertisers. A video from the inner Playlist runs for 10 seconds. The report records those 10 seconds twice: once for the inner Playlist with its advertiser, once for your Playlist with yours. Both are right. The inner Playlist was on screen for 10 seconds, and so was the Playlist holding it.
ON SCREEN                        RECORDED AS      ADVERTISER   TIME
Your Playlist .................. page             A            10 s
  inner Playlist ............... embedded page    B            10 s
    video, plays 10 seconds
The video plays once, and both Playlists were on screen while it did, so both are credited with the same 10 seconds. Nest a third Playlist inside and you get a third record, on the same pattern.
What that means in practice:
- Nothing is hidden and nothing is merged. Every level that was on screen gets its own record.
Playlist A ....... record 1
  Playlist B ..... record 2
    Playlist C ... record 3
      video, plays 10 seconds
- Each level keeps its own advertiser. An advertiser set further in is not overwritten by one set further out, and the other way around.
outer Playlist, advertiser A ... recorded as A
  inner Playlist, advertiser B . recorded as B
- You can tell the host from what it hosts. The outermost item is reported as a page, everything inside it as an embedded page.
outer Playlist ... page
  inner Playlist . embedded page
    deeper still . embedded page
- Advertisers belong to pages, not widgets. Widget statistics tell you how long a widget was playing; they never add a second advertiser.
page ............. advertiser A
  video widget ... no advertiser, playing time only
- Performance Mode makes no difference here. It changes how the content is played, not what is recorded or who is credited.
Performance Mode off ... page   advertiser A   10 s
Performance Mode on .... page   advertiser A   10 s
Each advertiser's own report is correct, but the same seconds appear in more than one of them when content is nested. Reconcile per advertiser, and do not sum several advertisers into one total.
Audience / Impression Measurement
Proof of Play can enrich playback statistics with audience context — an estimate of how many people actually saw your content, not just that it played. While content runs, the player keeps an active viewer count and stores audience metrics together with the same Proof of Play records used for content, asset, channel, advertiser, message, device, and folder reporting.
Audience metrics are only recorded while an active viewer count source is supplying values. With no source, the viewer count stays at 0 and no audience data is collected.
Viewer count sources
The active viewer count can come from any of these sources:
| Source | How it works |
|---|---|
| Device predefined count | Set on the device itself as a default value with optional date/time rules — see Predefined viewer count in the device settings. |
| Content action | An action inside your content sets the active viewer count at runtime — from a static value, a received value, a datasource, or a sensor-derived value. |
| Sensor event | External people-counting hardware sends viewer-count values, for example microwave/radar occupancy sensors or camera-based people-counting integrations. |
| Datasource event | A datasource update supplies the viewer-count value, for content-driven integrations. |
| Embedded / client integration | An embedded or runtime client sets the active viewer count through the player integration. |
Negative or non-numeric viewer counts are ignored and fall back to 0. Rapid changes are throttled, so the most recent value wins after a short cooldown.
Audience metrics
Once a viewer count source is active, these audience metrics are reported alongside the standard Proof of Play data:
| Metric | Meaning |
|---|---|
| Total impressions | Estimated number of audience impressions (viewerCount). Viewers already present when a content starts are carried over, so they are not lost when the next content begins. |
| Total view time | Total playback time weighted by the viewer count (viewerAttention). |
| Attention ratio | A ratio describing viewer attention relative to playback (viewerAttentionRatio). |
| Average attention | Average view time per impression (viewerAverageAttention). |