Databinding
Databinding is what turns a Widget from a static shape into something that shows your own, live data. This article covers the whole path: where that data can come from, how databinding differs from simply embedding something, and how to bind it to a Widget once you have it.
The real value is separating the design from the data living inside it: build an appealing menu board once, connect it to a datasource, and from then on an updated price list is all it takes — no more hand-editing the Content, and no risk of breaking the design while you do.
The data just has to be the right kind for that Widget — an Image Widget needs a valid image URL, a Google Docs Widget needs a public "Publish to web" link, and so on for each Widget's own Content settings.
The one exception is the Power BI Widget: it embeds a Power BI report directly and can't be data-bound in this sense.
If you already have connected data, you can skip to the databinding steps here.
Databinding is not embedding
Databinding connects to the data — numbers, text, rows — so you can filter it, combine it, and lay it out with Wallboard's own Widgets (Table, Bar Chart, Text, …).
Embedding brings in the whole rendered item instead — a live page, exactly as it's formatted, not data you can touch.
Learn more: How to Embed External Content, password-protected content, alternative methods, in a separate webview.
A few Wallboard features are easy to mistake for one when they're the other:
- The Power BI Widget is technically embedding — the report renders exactly as built in Power BI, not as Wallboard chart Widgets.
- The Power BI datasource, despite the name, isn't real data either: it returns a screenshot of the report as an image, the same as a Screenshot datasource.
- Streaming usually does not go through a datasource, rather it utilizes the Stream Widget (live video) as media url, not a datasource.
- Google Sheets can be any of three things: the Google Sheet datasource gives real, bindable data; the Google Docs Widget embeds the whole sheet exactly as formatted; and syncing it from a connected Google Drive folder keeps the formatting too, but as a PDF shown in a PDF Widget.
- Google Calendar has the same split: the Calendar datasource gives structured events you can filter and bind (see Datasource mappers' Calendar presets), while the Calendar Widget embeds the calendar exactly as it looks in Google Calendar.
Data in Wallboard
Wallboard datasources come in three families:
- Internal datasources — a table you manage by hand, inside Wallboard itself: type or paste the data in, and optionally make it editable from a device too. Use this when there's no outside system to pull from at all, or when you just want full manual control. Learn more: Internal Datasources.
- External datasources — connects Wallboard to an outside system: a spreadsheet, an API, a database, or a dashboard. This is the broad family the rest of this section walks through. Learn more: External Datasources.
- System datasources — data Wallboard generates about your own setup rather than an outside source: a summary of your devices, a summary of your uploaded Files, or a screenshot of one of your own Contents. Use these when what you want to show is something about Wallboard itself. Learn more: System Datasources.
Where does your external data come from?
Before you can bind anything, decide how the data gets into Wallboard in the first place. That depends on what the source system can offer.
If the source already has a clean export or API
| Source offers | Use this datasource | Learn more | Worked example |
|---|---|---|---|
| A spreadsheet (Excel or Google Sheets), exported or kept up to date by hand | Microsoft Excel / Google Sheet datasource | Microsoft Excel datasource, Google Sheet datasource | Create a Dynamic Menu using Excel |
| A free public feed, or any HTTP endpoint that returns JSON | JSON datasource | JSON datasource | — |
| The same, but the feed returns XML | XML datasource — Wallboard converts XML to JSON automatically, so you bind it the same way as JSON | XML datasource | How to create content with an XML datasource |
| A database you can query directly | JDBC datasource | JDBC drivers | — |
| A system that should push data the moment it changes, rather than wait for a schedule | A webhook into an internal datasource | Datasource actions | Hotel Inventory and Pricing |
| A report already built in Power BI | Power BI Widget (embed it), or the Power BI datasource (pull it as an image) | Power BI widget, Power BI datasource | — |
| Any other dashboard with a shareable URL (Grafana, Tableau, Looker, …) | Screenshot datasource — Wallboard regularly captures the page as an image | Screenshot datasource | — |
Spreadsheet, JSON, XML, JDBC and Screenshot sources are refreshed on a schedule that you set on the datasource. A webhook is pushed by the source system instead, so the screen changes as soon as the data does — prefer it for data that changes every few seconds, such as a live counter.
If the source needs authentication
JSON and XML datasources support the two simplest methods directly, under Request settings: Basic auth (username and password) and a Custom header (for an API key or Bearer token). Cloud Credentials are a separate thing — they handle sign-in for Wallboard's own named integrations (Google, Microsoft, Power BI, …), not for a generic JSON or XML endpoint.
Neither datasource type supports OAuth2 (exchanging a client ID and secret for a short-lived token) or other complex authentication on its own. When the source needs more than that:
- Check Other credentials first — Cloud Credentials' Other tab ships pre-built authentication for a growing list of named business systems (Ad Astra, EMS, Nexudus, Oracle Cloud OHIP, …). If the source is on that list, this is the proper, self-serve way in: no workflow tool or custom development needed.
- Otherwise, put a workflow automation tool — such as n8n — in between: it fetches the token, calls the source's API, optionally combines several sources into one, and exposes the clean result on its own webhook address, which Wallboard reads with an ordinary JSON datasource.
- Or ask Wallboard to build a Custom datasource — a bespoke integration for authentication or coordination that goes beyond what a workflow tool should have to handle.
If there's no structured export at all
Two fallbacks, in order of how reliable they are:
- Web scraper datasource — point it at a web page and describe what to extract in plain language; Wallboard loads the page in a real browser (so JavaScript-rendered pages work) and an AI extracts the data. Give it an example structure or a JSON Schema so the shape stays stable release to release.
Learn more: Web scraper datasource. - AI datasource — a system datasource you drive with a prompt, optionally fed by other datasources and able to use built-in tools (web search, URL fetch, image analysis, Google Maps, image generation). It's the most flexible option and the least reliable, since it depends on what the AI finds — reach for it when nothing structured exists, or to combine two unrelated datasources into one.
Both the Web scraper and the AI datasource run on AI, counted per customer as an hourly and a monthly token budget; once a customer reaches it, refreshes are blocked until the next window opens.
Plan the refresh interval accordingly — a feed refreshing every minute spends the budget far faster than one refreshing every 15.
Is a spreadsheet enough, or do you need developer help?
A spreadsheet is usually enough when the data changes a few times a day rather than every minute, people already update it by hand, or the source has no API but can export to a file.
You need help on the source system's side when it's closed with no export or API, uses its own proprietary authentication, or several sources need combining into one feed — a workflow tool or a Custom datasource can solve this, as above. You need help on Wallboard's side when you need interactivity beyond page navigation, custom data transformations, or a visualization no Widget offers.
- EMEA support: [email protected]
- US support: [email protected]
- A paid development project: [email protected]
- Sales: [email protected]
Databinding Steps
Binding works differently depending on whether the Widget shows one value or many at once — a Text Widget needs one piece of text, a Table Widget needs a whole array of rows. Both start the same way, then split.
Single-value widgets (Text, Image, Video, …)
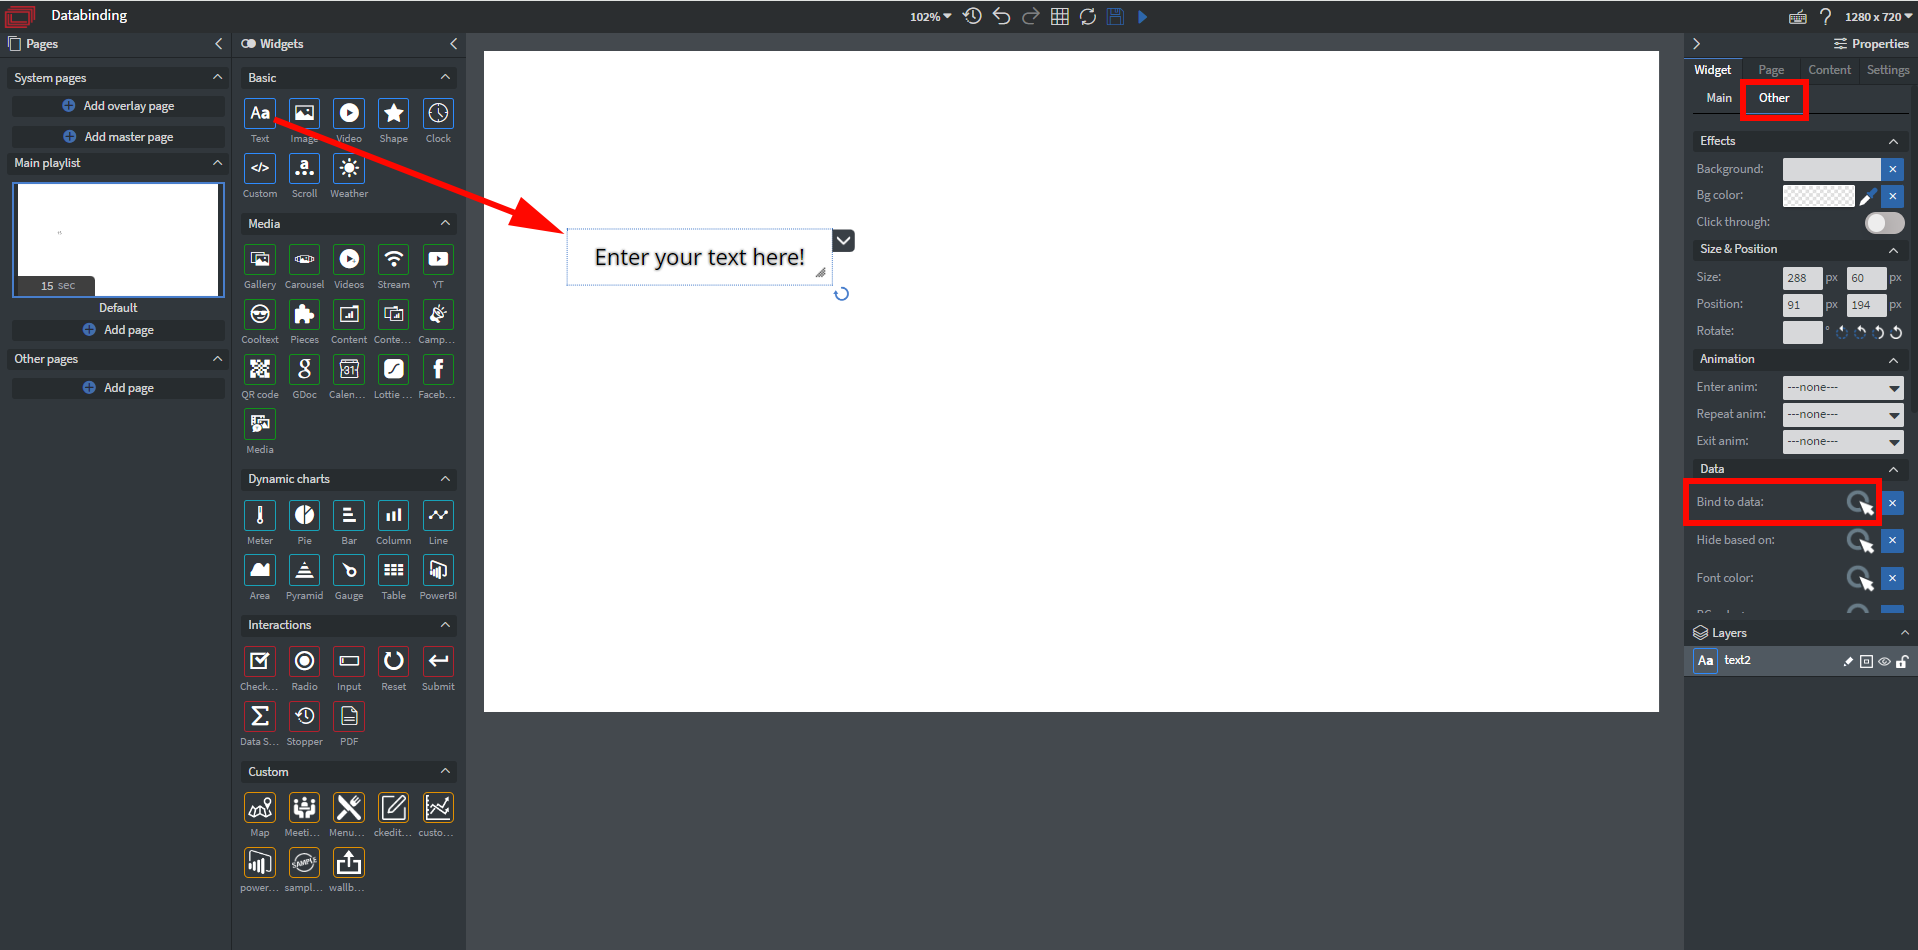
- Drag & drop the widget onto your content.
- Select the widget.
- Go to the Other tab > Bind to data option under the widget's properties.
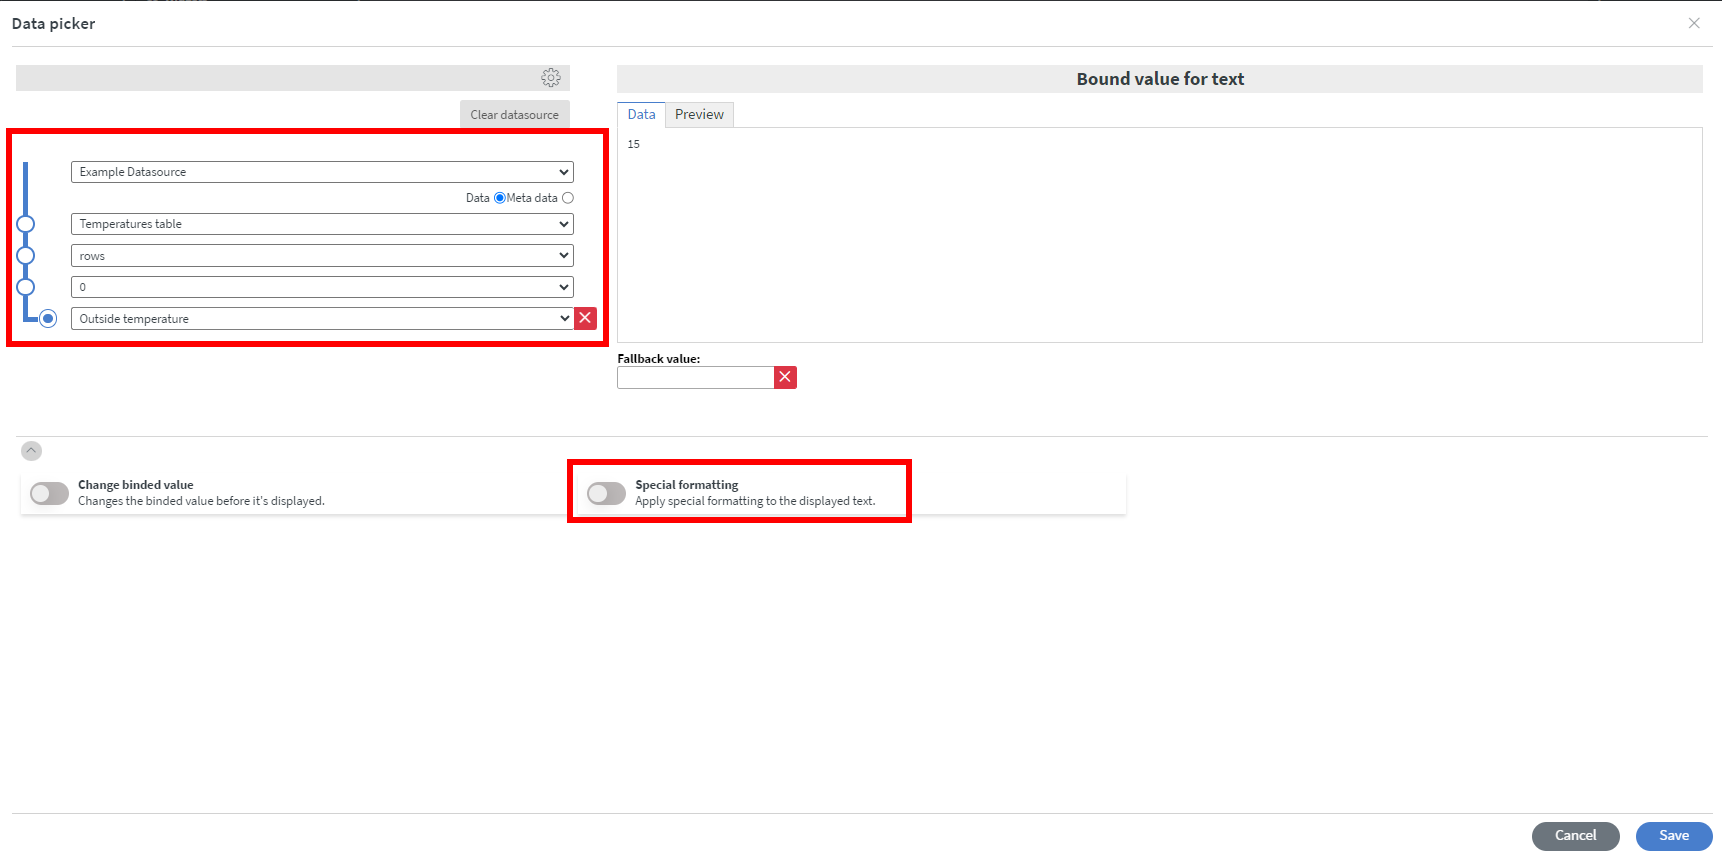
Select the datasource you created previously from the dropdown. From the appearing dropdowns you can specifically choose which data you would like to display.
You can optionally apply special formatting to your values here if you want them to appear different from your original dataset.
Before saving, remember to check if your data is displayed correctly in the preview window in the upper right.
Multi-value widgets (Table, and similar list-driven widgets)
A Table Widget doesn't bind one value — it binds a whole array at once, so its Data picker has extra steps the single-value flow above doesn't.
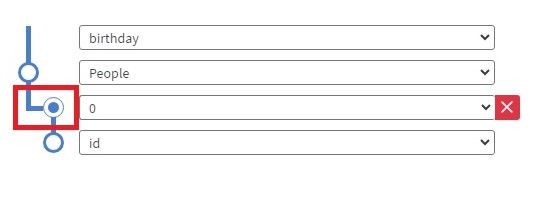
A datasource is a tree of nested objects and arrays. Binding one value just means pointing at one spot in that tree — but binding a table means telling Wallboard which level of the tree repeats. The pivot point marks that level: everything at and below it is treated as one row, and that row's shape becomes the template reused for every item in the array. Skip it, and Wallboard has no idea anything should repeat at all — which is why an unset pivot point leaves a table with no columns, not just empty ones.
The same blue-dot pivot point marker shows up anywhere Wallboard binds a repeating collection, not just the Table Widget — for example, picking which array level repeats in a JSON-driven content:
- Select the Table Widget, then Bind to data the same way as above.
- In the Data picker, select your datasource, then choose Rows from the dropdown that appears — this is the array of data the table will draw from.
-
A row-index dropdown appears next to it. Select 0.
-
At that 0 row, click the table icon to the left of the dropdown. This sets the pivot point — it turns blue once set, and tells Wallboard to use that row's shape as the column template for every row in the array, not just row 0.
Without it, Wallboard sees a numbered array and has no column names to show. If a table looks empty or has no columns after binding, this is the first thing to check.
- Switch to the Select Columns tab. Toggle Visible on for each column you want to display, and relabel or resize them as needed.
- Save, and check the preview — every row should now be populated.
Learn more: Table Widget, worked example: Create a Dynamic Menu using Excel.
Watch YouTube tutorial video
If you have further questions please do not hesitate to contact us at [email protected]. Happy editing!