Proof of Play
What is Proof of Play?
Proof of Play is a statistics option to gain information about the below listed elements:
- Loops and Contents that contains assets with Proof of Play
- Used files with Proof of Play
- Screens that played elements that contains assets with Proof of Play
How to enable Proof of Play?
To make Proof of play reports, You have to enable it when You edit your Contents, Loops.
 |
|---|
| Widget --> Other --> Proof of Play |
In Contents you have the opportunity to enable widget statistics as well as asset statistics.
Widget statistics
After you enabled widget statistics, you can gain proof of play data from the widget itself.
- How many times the widget was played
- How many clicks happened on the widget
- etc
Widget level report will not collect proof of play data from the assets inside!
To see the reports in chart form, please use our new 2.0 UI.
More info about Proof of play in 2.0 ui: here
Asset statistics
After you enabled asset statistics, you can gain proof of play data from every single item that has been played inside the widget.
- How many times the asset was played inside the widget
- How many clicks happened on each asset inside
- etc
For example:
- You have an image widget, which can contain only 1 image, you can gain report from only this image.
- But if you have a gallery widget with 5 images, you can gain report from every single item that is inside the widget.
Asset level report will not collect proof of play data from the whole widget!
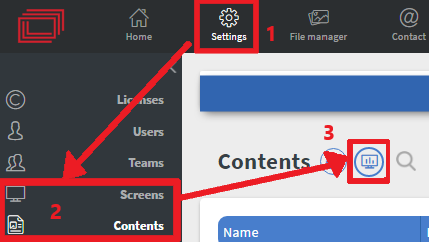
Where can you collect statistics of Proof of Play?
Section headers: We have this icon next to the Section headers of our Home screen:
- Section Headers's Proof of Play give us information about elements that are in the section where You chosed the Proof of play.
- Loops and Contents give us the same information about the loops and contents where You have elements with enabled Proof of Play.
 | Proof of Play for all screens |
|---|---|
 | Proof of Play for all contents and loops |
 | You can also find this icon in You navigate yourself into File manager |
If you navigate yourself into Settings --> Screens or Contents, and select the Proof of Play you will get the same report when You chose the option mentioned above.
 |
|---|
There are many options to get reports only a specific Screen, Content, Loop or Media asset:
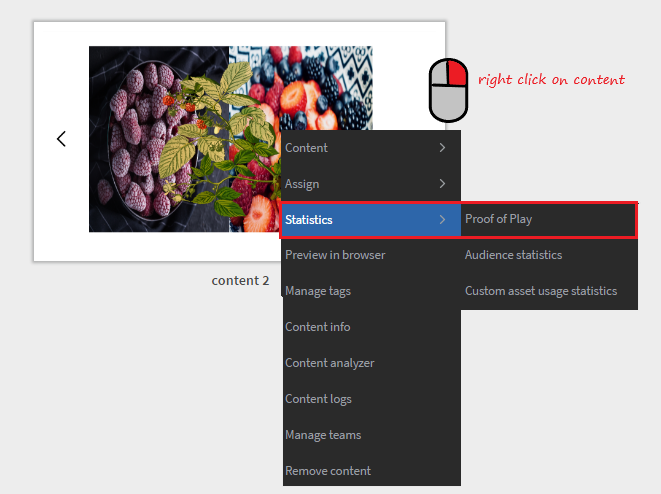 | The Proof of Play You choose with this method is only for the chosen Content, Loop , Screen or File |
|---|---|
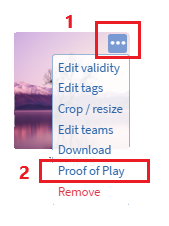 | The result is the same when You choose a file from your folder to check the Proof of Play, |
| or when you check it in Settings --> Contents or Screens. |
If you choose Proof of Play not from the Section Header, it will report only the element where Proof of Play is enabled.
How to use Proof of Play pivot table?
Our example is based on Proof of Play for all contents and loops.
First of all, when you open the Proof of Play, you will see a Modal like this one:
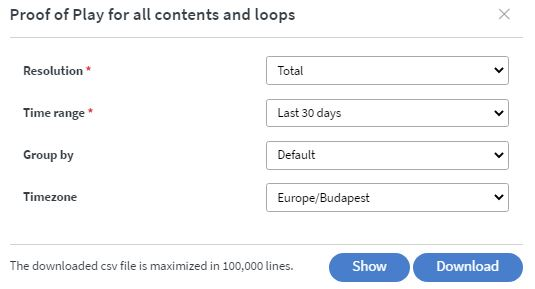 | Resolution: You can set the report interval to weekly or monthly. Time range: Set limit to the previously chosen time interval. |
|---|
Group By
The Group by option Widget does not have a pivot table view. That option is only available as a downloadable CSV statistic.
- default option based on duration and the contents
- content pages based on content page
If you have decided what kind of report you wish to see, you can download a csv with these basic configurations, but if you want to see further information in your report, you should click on the Show button where you will see the following table
--we will choose the content pages option--
 |
|---|
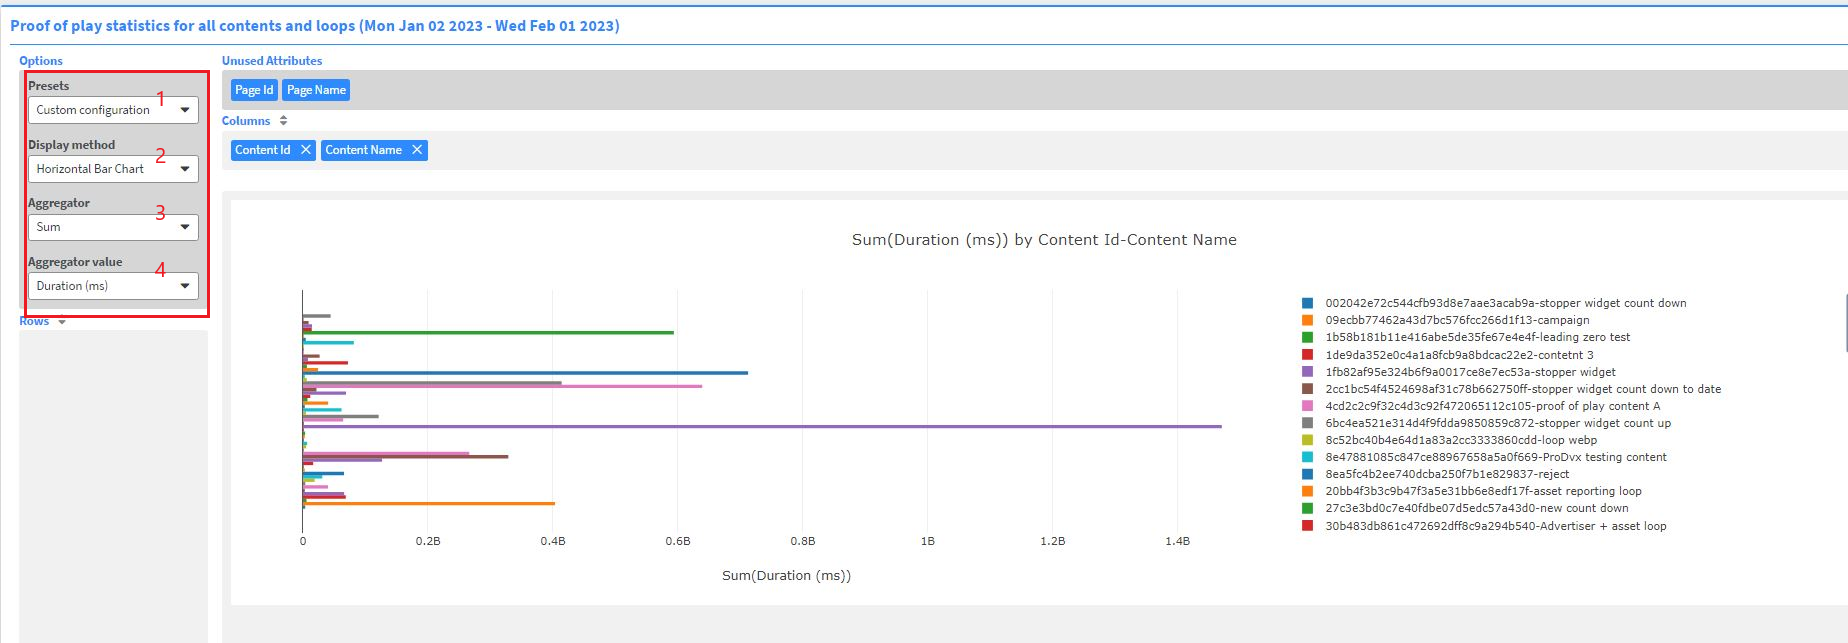
Presets
Presets helps you to make readable charts based on previously made settings what you can apply on your pivot table
Display method
- Display method let you change between different charts like barchart and tables like heatmap.
- If you choose the Horizontal barchart you can select the unwanted elements of your list and hide them.
- Chart based functions can be downloaded with the camera icon on the right.
- Table based functions cannot be downloaded.
Aggregator
Aggregator value is responsible for the value of the aggregation.
You cannot download the CSV if you click on the Show button, so if You are concerned you need the report you made in the Proof of Play modal please download it.