How to use datasource rules
This article shows you the steps of manipulating a widget using datasources.
Introduction
In this particular example we are going to change the text color of a clock widget based on the outside temperature. If the current temperature is hotter than 30°C the text color will go from black to red and if it is colder than 3°C it will turn blue. For demonstration purposes we are going to create a new internal datasource with the "TABLE" structure type.
Creating a new table
To do this navigate to Settings >> Datasources >> Internal datasources >> Add new and create a new table.
Other types of datasources can also be used. We are using internal datasources in this example to make the demonstration more simple. If you would like to use a different type of datasource please refer to the articles in our knowledgebase: Content editing >> Datasources.
Add columns to the table
Let's add 3 columns to our table. We need these values to decide if it is hot or cold outside. Click the pencil icon labeled Edit json on the right side of our newly created table and add 3 columns as shown below.

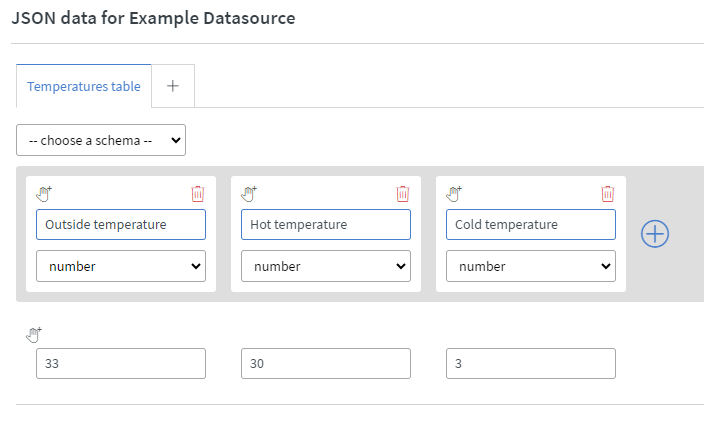
If configured correctly your raw JSON data should look like this:
{
  "Temperatures table": {
    "header": {
      "Outside temperature": "number",
      "Hot temperature": "number",
      "Cold temperature": "number"
    },
    "rows": [
      {
        "Outside temperature": 15,
        "Hot temperature": 30,
        "Cold temperature": 3
      }
    ]
  }
}
To make choosing the relevant datasource easier for later, remember to rename the table by double clicking on its name up top.
- In the example above we renamed it to Temperatures table.
Outside temperature will simulate our real-time outside temperature. If it is higher than the value we set as our Hot temperature the text on our widget will turn red, however if it is lower than our Cold temperature value it will turn blue.
Creating a clock widget
Now let's navigate to the content editor and add a clock widget to our page. On the right side in the widget's main settings change the type from analog to digital.
With the clock still selected click on the other tab and from the menu choose the Font color option under Data.
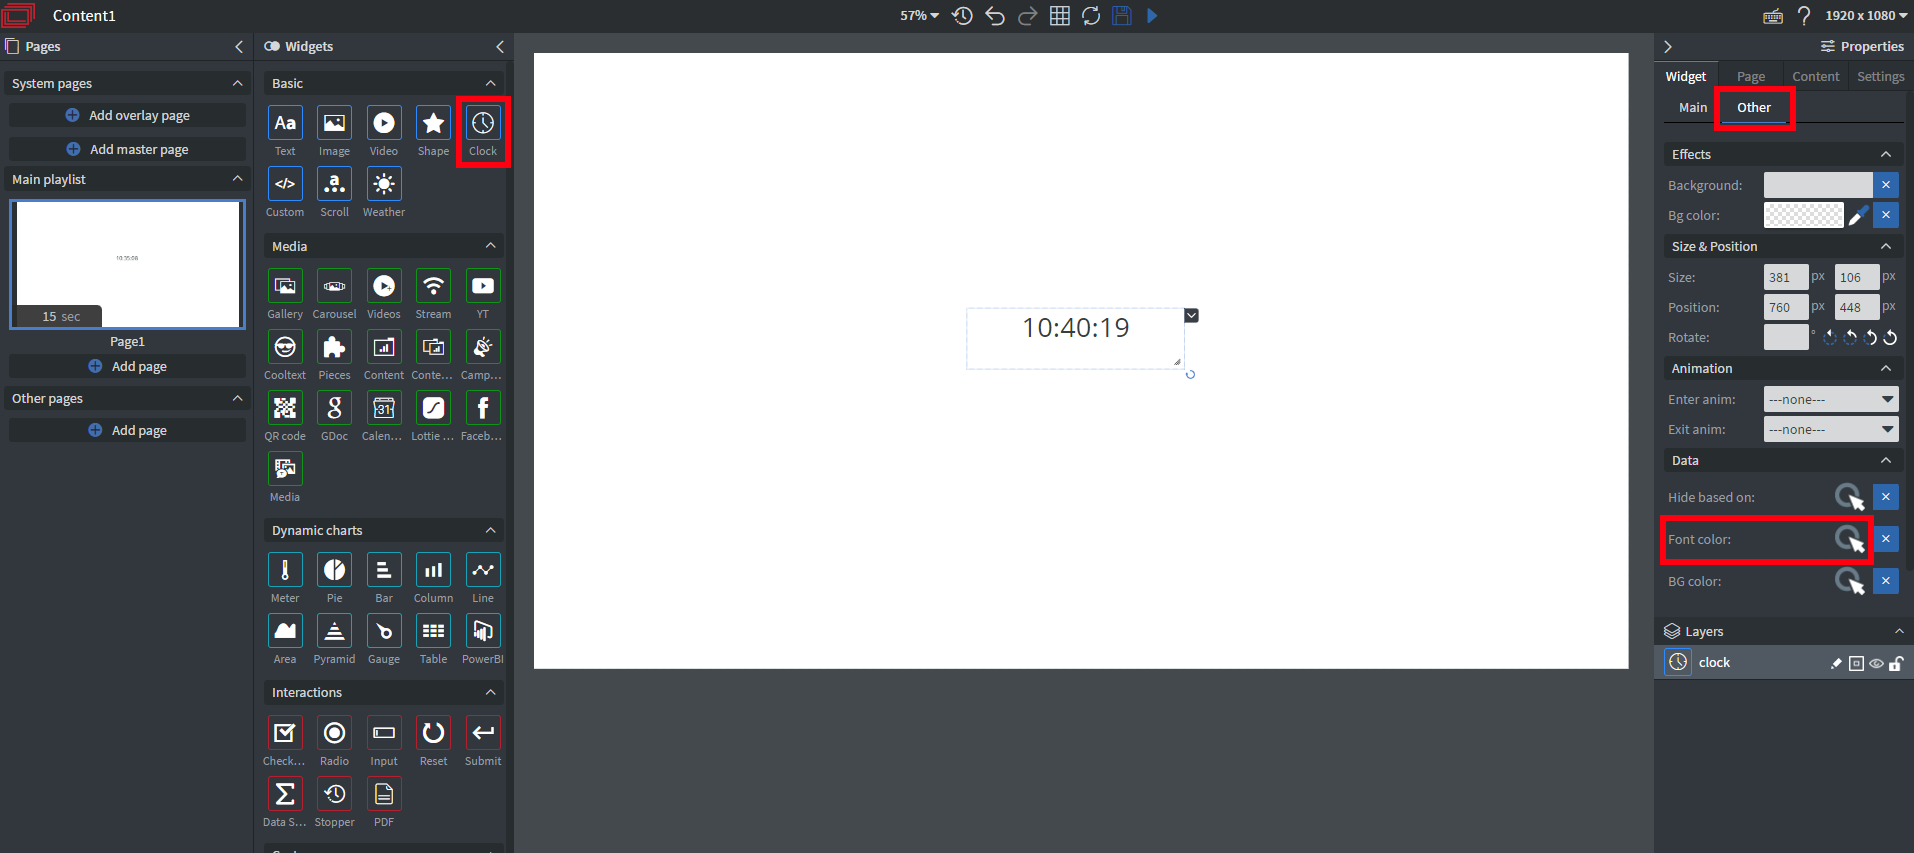
In the dropdown menu select the internal datasource we created and then select the outside temperature. This will be our reference value for the comparison.
For color rules we also need to set the type to Rules.
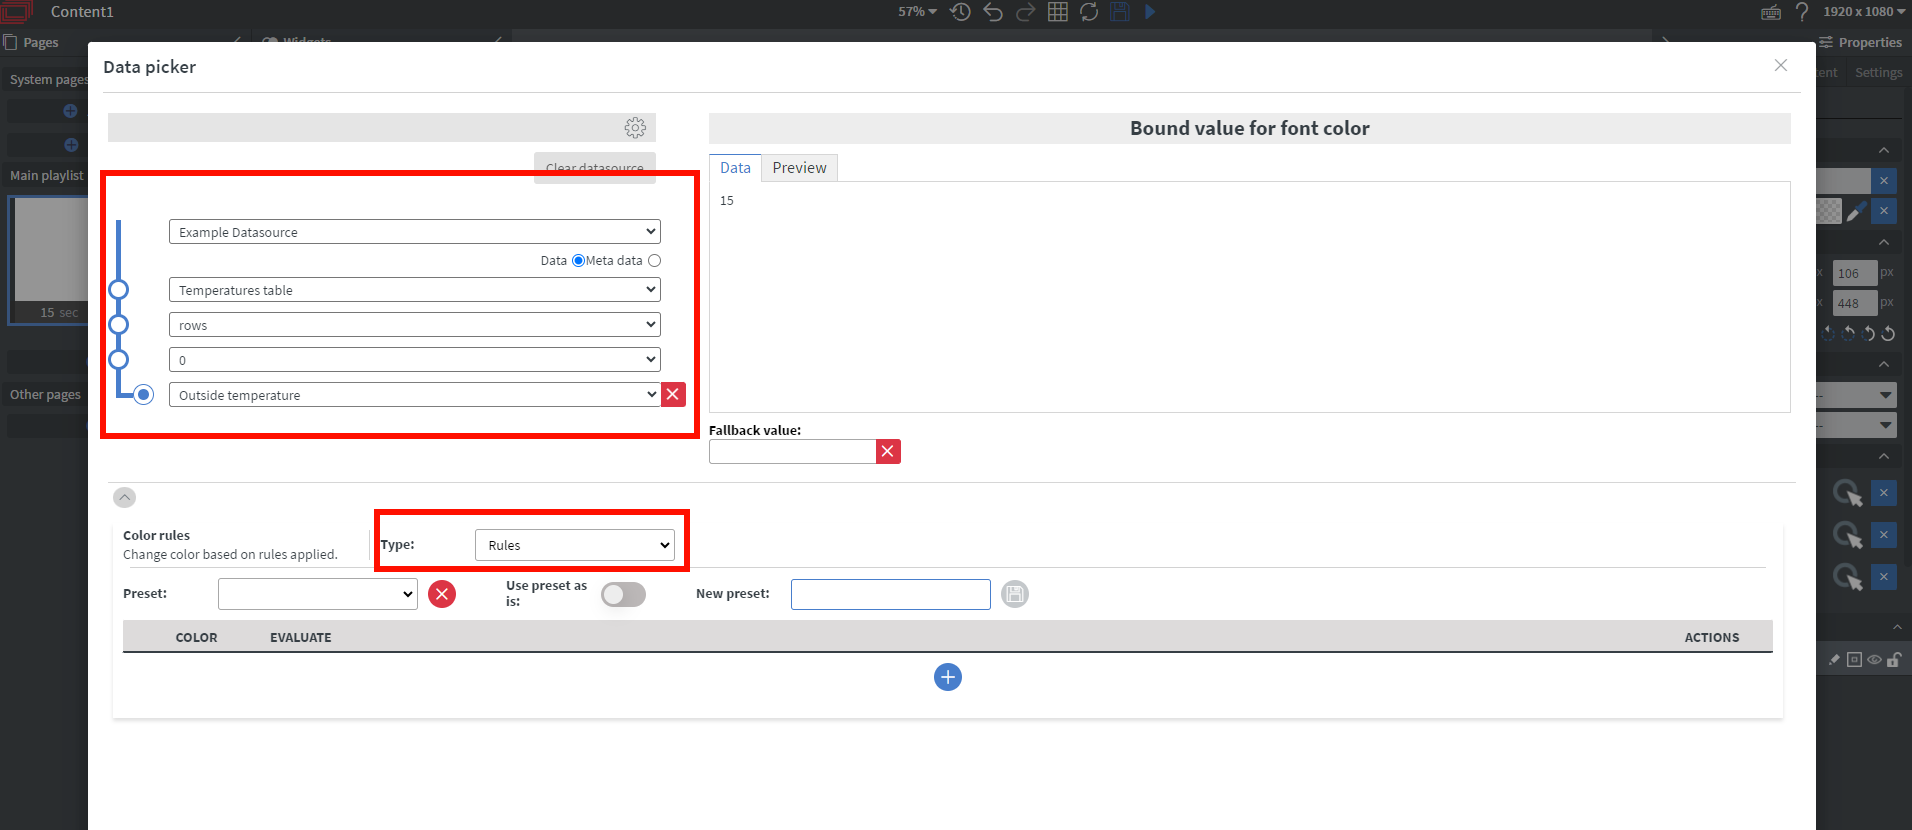
We can now begin adding our own conditions in order to change the color of the text. Use the blue + icon to add a rule.
As previously discussed we will need to add two conditions:
- If the temperature is greater than 30°C (Hot temperature value in the table) we need to change the color to red.
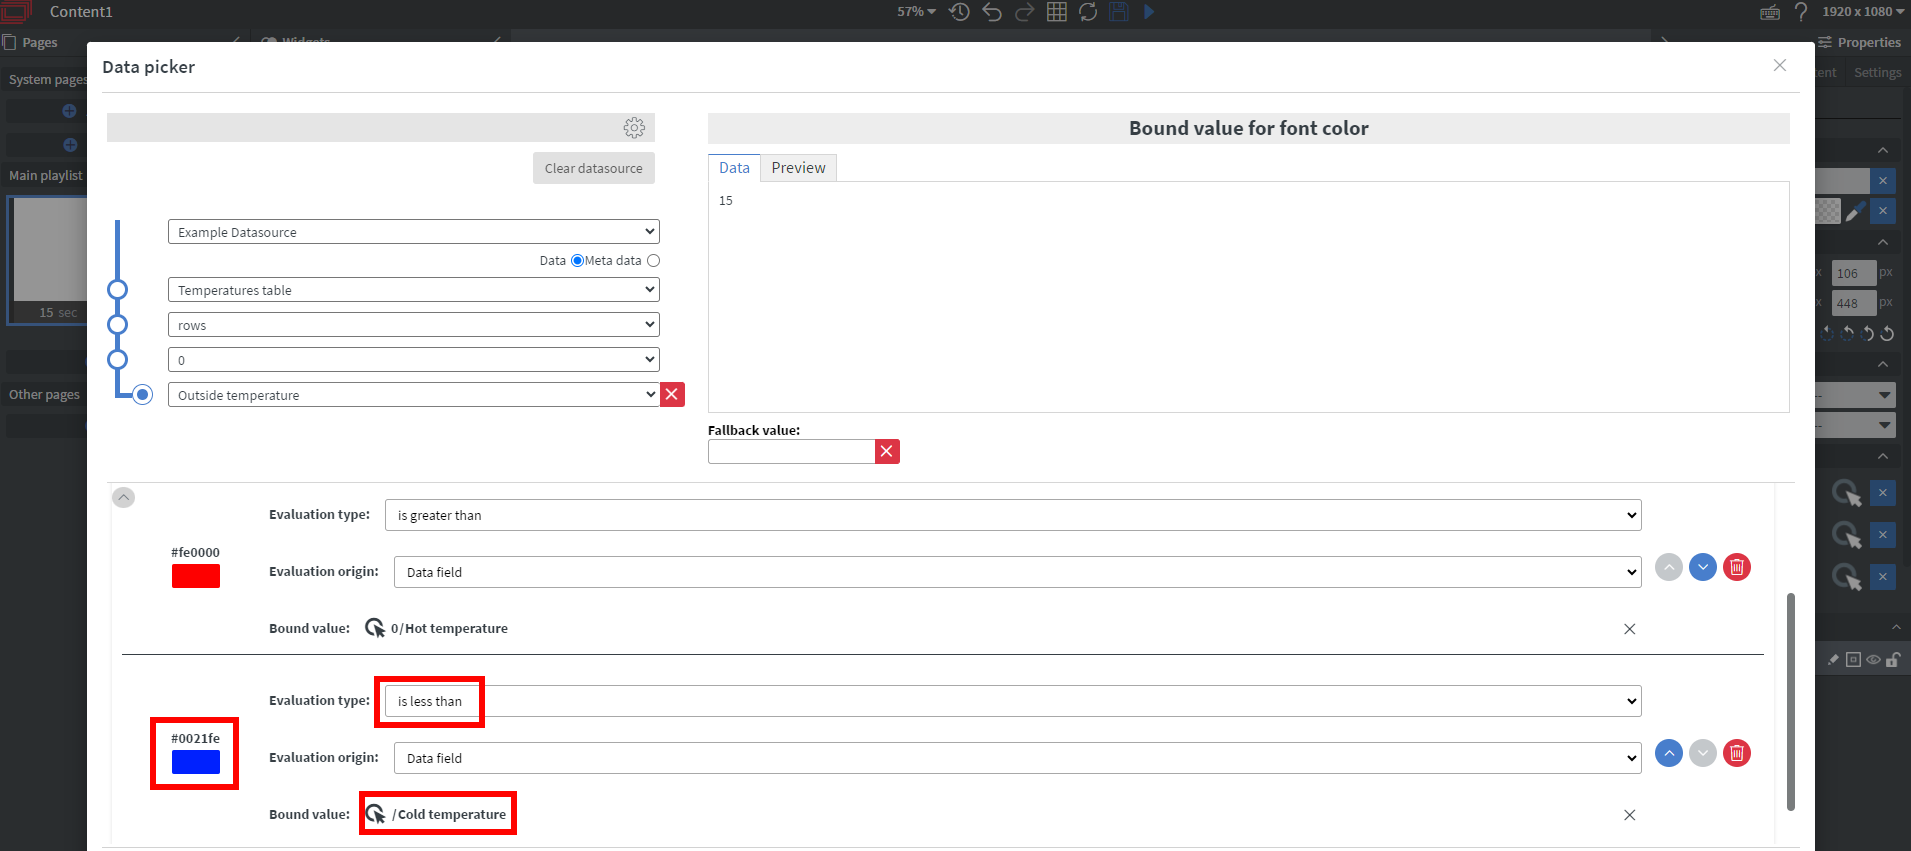
- If the temperature is less than 3°C (Cold temperature value in the table) we need to change the color to blue.
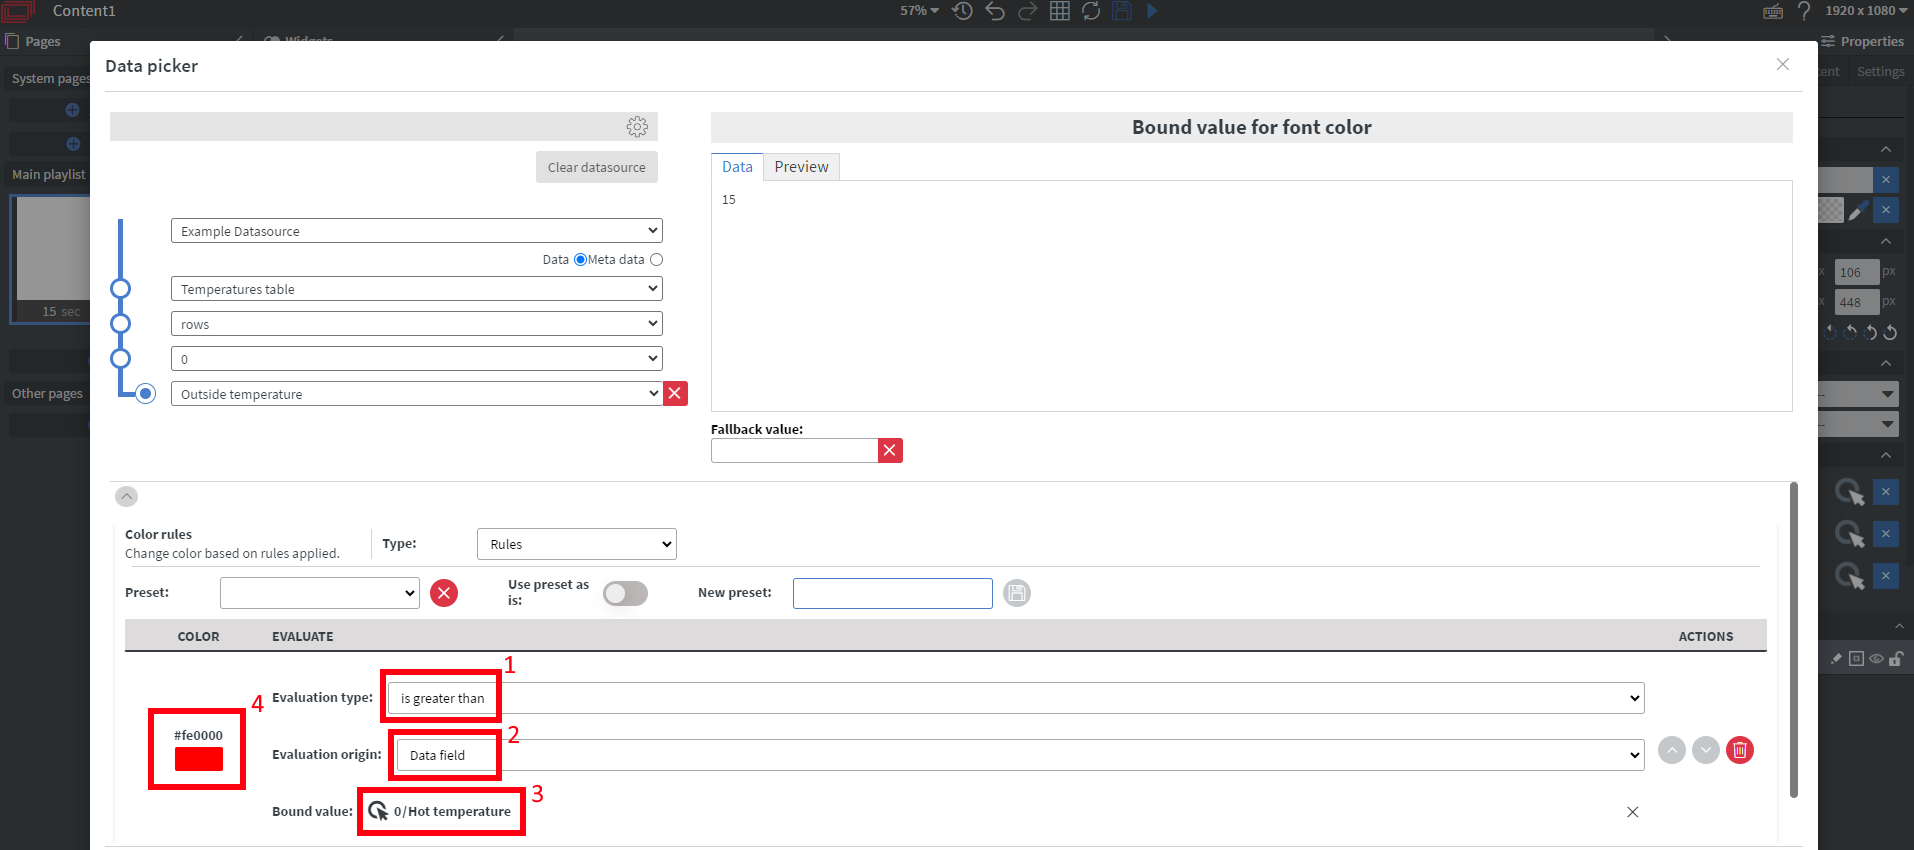
- 1: Select is greater than
- 2: Select data field as evaluation origin.
- 3: Select the bound value. A similar popup window will appear as before, only this time we need to select the Hot temperature value because we will be comparing our Outside temperature to this.
- 4: Using the color picker let's choose the red color. If the conditions we set are true, this will be the color our text changes to.
The first condition is now completed. We are now moving on to the second condition (Cold temperature).
With the blue + button under the Hot temperature rule we can add another rule.

Do the same steps mentioned before but with the below highlighted appropriate properties.
Testing functionality
Click the Save button on the bottom right and we're all set to do some testing to check if we've configured everything properly.
Head back to Dashboard >> Settings >> Datasources >> Internal datasources >> Edit JSON (in the row we created our table) and change the Outside temperature
to a value smaller than the value in the Cold temperature field. After clicking Save&Close go back to the content page and the text color should change to blue.
If we set the Outside temperature value to something higher than our Hot temperature value the clock will change to a red text color.
If the Outside temperature value is between our Hot and Cold boundaries the text color defaults to black.
If you have further questions please do not hesitate to contact us at support@wallboard.info. Happy editing!
Downloadable content
Content for Datasource Rules testing
NOTE: Please enable Import as Content in the import modal!